Maria Fernanda, a quantum physics Ph.D. and CEO of MOCA Platform, explain us in a simple way how companies can extract business value using big data in order to increase revenue and maximize profitability.
From data to value
John owns a new online travel agency called Travel.com. It offers 3 travel packages to exotic destinations: a safari in Africa, a trip to the Galapagos Islands and a trip to Hawaii with scuba diving training included. Travel.com has been in the market for 2 years and it has been really successful. The website gets 800 visits per day on average and it sells about 80 travel packages per week. The average package price is about €1200 so the sales of the last year were about €4.5M.
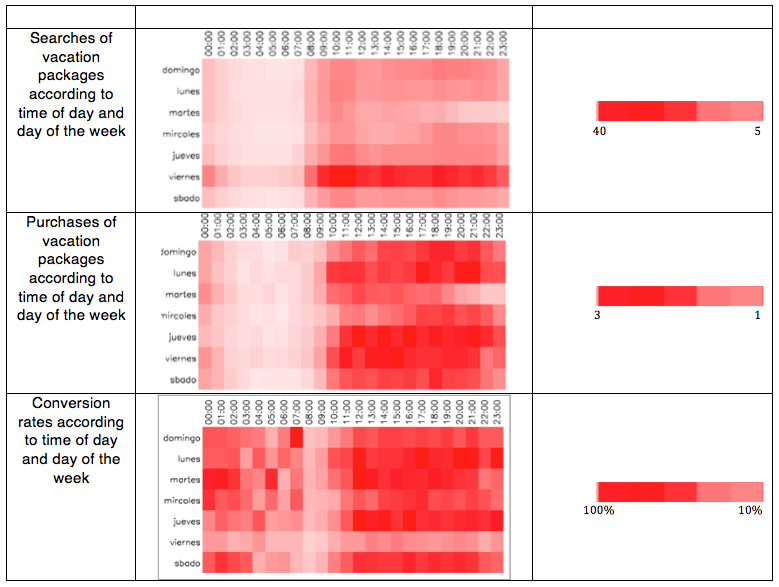
John is an entrepreneur who believes and invests in new technologies. He has a website, a mobile app and 2 brick and mortar stores in 2 different cities: Barcelona and London. From the very beginning, he was aware of the significance of attracting new customers and keeping them happy. Now the business is starting to grow and it needs to become more competitive. John starts by analyzing the data he already has from the website. He hires a data analyst to whom he gives all the historical data in order to undertake an initial analysis. Some weeks later, the analyst presents a preliminary report which shows the package sales according to the day and time.
He looks at the image and starts wondering:
- Why are most of the searches done on Fridays after 5 pm? His analyst thinks that it might be due to work time. It seems that at the end of the week people are looking forward to travel, even though it’s not the best time to buy tickets, according to the conversion rates.
- Why are there lower sales on Tuesdays, Wednesdays, and Saturdays? It seems that during these days people buy fewer packages, especially if we compare it with the other days of the week. However, the conversion rate is higher.
- Why does the conversion rate increase during the early hours in spite of having fewer searches and purchases? It is likely that people who decide to travel and who search during the early hours are more willing to buy.
When he sees the first data record, he starts to wonder and after a thorough analysis of his employee’s data, he begins to find the answers, as follows:
- What’s the most appealing trip package? Which store have higher sales? Which store have lower sales?
- Galápagos has the highest sales and it’s sold at the Barcelona store.
- The London store has the lowest sales.
- Where are the customers who buy more packages from?
- Rusia. He knows that because of the IP data on the website.
- These packages are also bought at the Barcelona store.
- Why only a few percentage of people buy the packages if there are a lot of visits in the website?
- The scuba diving training and the safari seem to be more appealing packages although they have the lowest sales.
- The safari is sold a 20% less than the scuba diving training.
Based on the data, John has made the following conclusions:
- He needs to hire another salesperson at the London store.
- He needs to translate the website into Russian and do an online Russian campaign in order to sell his products.
- He must offer discounts on the safari packages at the physical stores in London and Barcelona.
- Promoting online purchases is important.
Now, John has all the information he needs to drive his business. It allows him to improve and redirect his sales strategy.
Want to learn more about how to leverage big data analytics to discover patterns in customer behavior and predict trends? Stay tuned for the next part of this post.


