Wi-Fi is the most versatile technology for modern audience analytics in venues. As a Big Data Location-based Marketing Platform, we’re constantly improving our analytics features and dashboards. Today, we’re glad to announce Wi-Fi based Audience Analytics for Indoor Locations such as shopping malls, airports, museums, and stadiums, and Outdoor Locations such as cities, villages, towns or countries.
This feature expands analytical capabilities of MOCA Wi-Fi Analytics product, which also includes indoor mobility flow, outdoor heatmap, dynamic indoor heatmap (watch how your audience flows, minute by minute), floor plan management, and more. Do you want to learn more about this product? Please, contact us here.

By understanding how people and devices move around a venue, marketing managers will be able to gain better visibility into the customer journey, measure effectiveness of offline campaigns, discover new commercial opportunities and refine their business strategy. MOCA’s Wi-Fi-based audience analytics allows an in-depth data analysis on users' behavior helping companies to convert insights into actions.
To start with, let’s see how it works and what is it for.
How does MOCA Wi-Fi work?
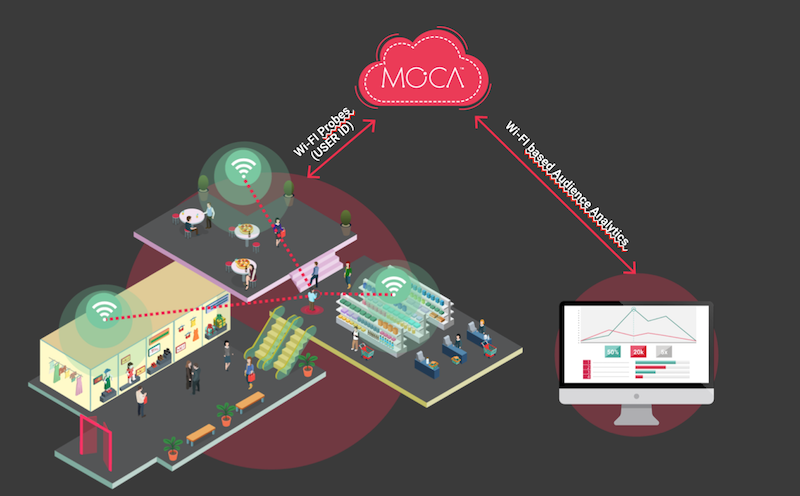
When a smartphone scans for nearby Wi-Fi networks, it broadcasts data packets called Wi-Fi probe requests. Each request includes a unique hardware identifier and it is picked up by nearby Wi-Fi equipment (i.e. access points). This identifier is called a MAC address.
MOCA platform integrates seamlessly with existing Wi-Fi solution providers, such as Cisco CMX, Cisco Meraki, HPE Aruba ALE, and similar. For Wi-Fi networks that do not support location services, MOCA accepts raw Wi-Fi probes sent by mobile devices and captured by Wi-Fi scanners (i.e. OpenMesh) and the location trilaterations are performed by cloud-based MOCA Wi-Fi Location Engine.

What is Wi-Fi based Audience Analytics for?
MOCA’s Location Intelligence Platform helps venue owners to get the most out of every inch of floor space. By better understanding how customers actually behave while on site, companies will be able to identify the most visited areas, measure the dwell time of visitors, optimize site layout and staffing allocations accordingly, get multi-site analysis for visits comparison and evaluate the offline impact of your digital campaigns.
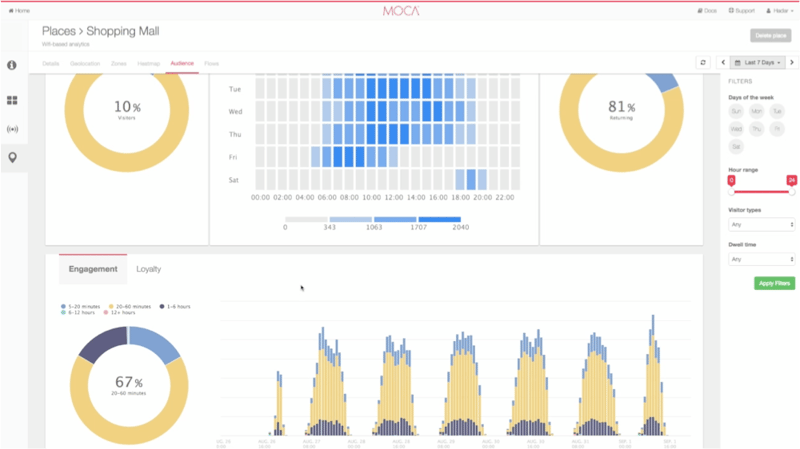
Using Wi-Fi based Audience Analytics dashboard, venue managers can get the metrics they need to measure and understand how the mobile users interact with the physical places. The information is shown using 3 key metrics:
Global metrics: it gives you a global overview of your audience on all your sites.
- Total number of visitors
- Total number of passers-by
- Total number of visits
- Average Dwell time
- Number of access points
Engagement metrics: it tells you how much time your audience spent per day and hour and helps you to identify new visitors Vs returning visitors.
Loyalty metrics: it provides you information about your audience and how frequent they visit your site. It helps you to identify new visitors, daily visitors, weekly visitors and so on.

MOCA’s Wi-Fi Analytics provides an enhanced way of investigating your data. Not only can you view the number of visitors per area an hour, it enables you to understand behavioral patterns of your audience into your venue.
As always, we’d love to hear your feedback, so drop us a line anytime!


